 SessionTap
Frequency data sheet
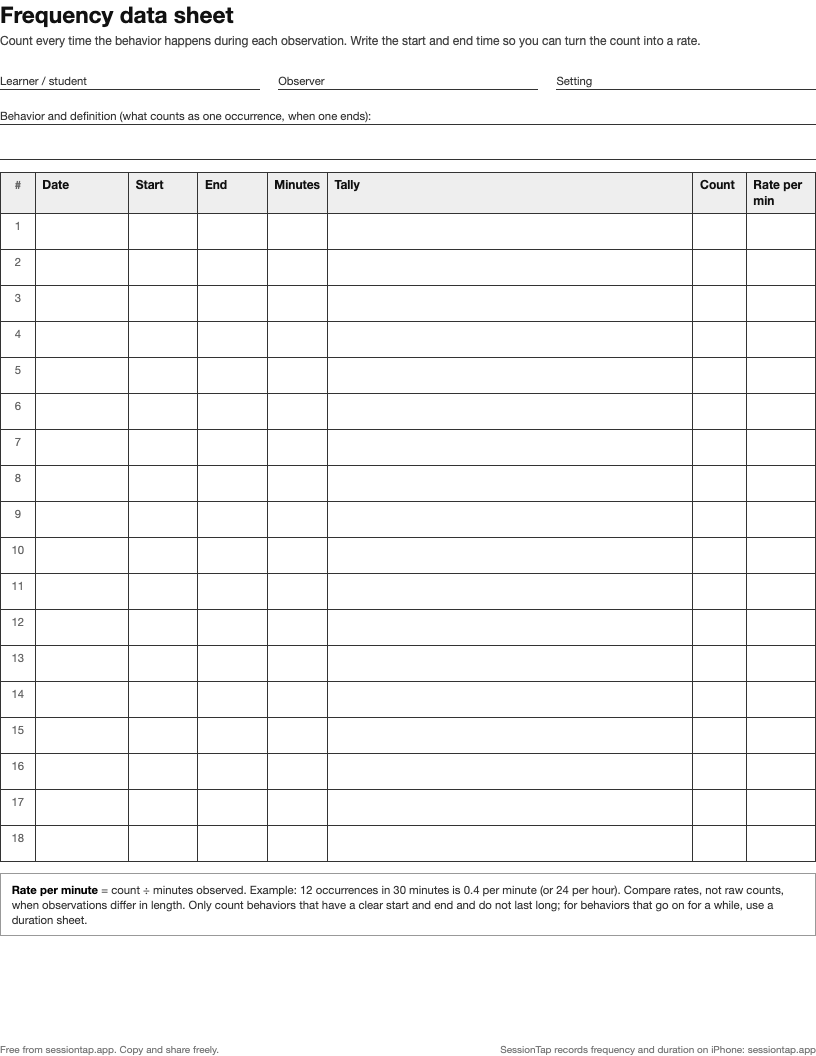
A one-page sheet for counting how often a behavior happens. It has room for 18 observations, each with a date, start and end time, a tally box, the count and the rate per minute.
How to fill it in
- Write the behavior and its definition at the top: what counts as one occurrence, and when one has ended so the next can start.
- For each observation, note the date and the start time.
- Make a tally mark every time the behavior happens.
- At the end, write the end time and the minutes observed, add up the tally into Count, and divide the count by the minutes for the Rate per min.
Count or rate?
If every observation lasts the same length, counts can be compared directly. If they don't (20 minutes on Monday, 45 on Tuesday) compare the rate instead. Eight hand raises in 20 minutes is 0.4 per minute; twelve in 45 minutes is about 0.27 per minute, which is fewer, even though the count went up.
Frequency works best for behaviors that are brief and have a clear start and end: hand raises, hits, requests, calling out. For behaviors that last a while, such as a tantrum or time on task, a duration data sheet tells you more. The frequency recording guide covers both questions in more detail.
The same sheet on a phone
In SessionTap each behavior is a button. A tap adds one occurrence with its time, and when you end the session the app shows the count and rate per minute for each button, so there is nothing to add up. You can count several behaviors on one board and export the session as a CSV.